買新車就像新官上任一樣,什麼東西都想搞一下,而且換的是油電車,當然要記錄一下油耗。
雖然MyPeugeot APP會幫你同步每一次用車的油耗,但我也想知道每桶油的油耗表現怎麼樣。找了整個iOS App Store,不是功能太多用不到,不然就是簡體中文的名稱,再不然就是插了一堆廣告,完全找不到一個滿意的APP。
那不然就自己做吧?結果iOS的App需要Macbook才能編譯,上架流程看起來也很繁瑣,只好放棄這條路,改用前後端網頁架構來偽裝成一個APP好了,反正伺服器也是自己的,沒有寄人籬下的問題。

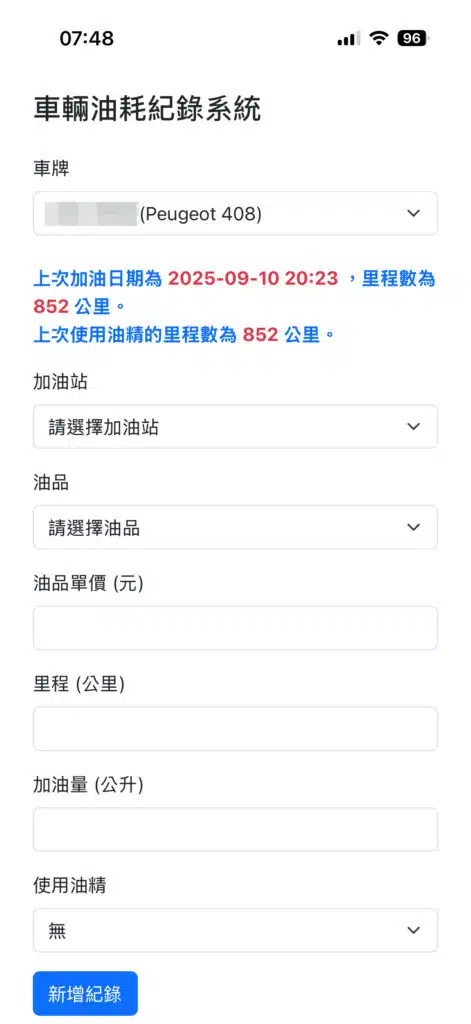
設計上很簡單,需要填的選項不多,不然加個油像在填問卷一樣。

可以選擇車輛,家裡有二台車,這裡可以分開管理。選取車輛後會提示上次加油的日期跟里程數,我有固定在使用汽油精,所以也會提示使用汽油精的里程數。
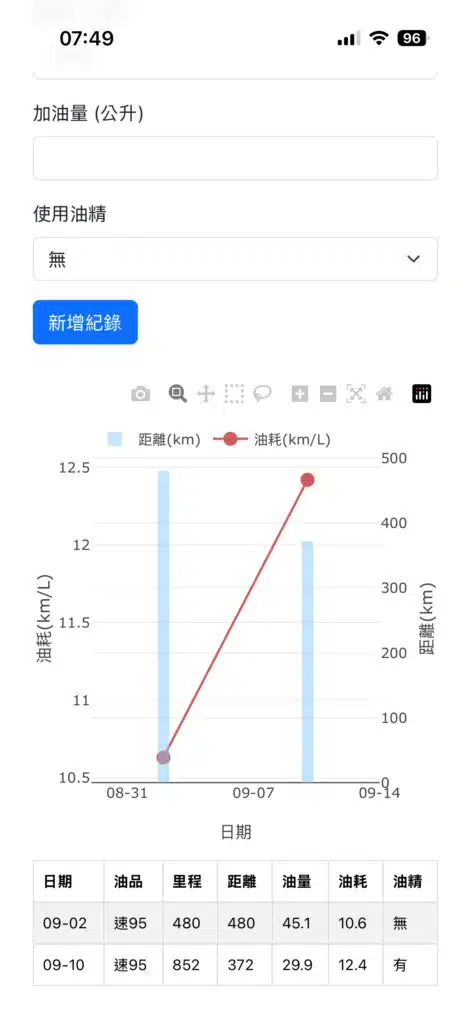
捲到最下方就可以看過去加油的紀錄,以圖表跟表格顯示。
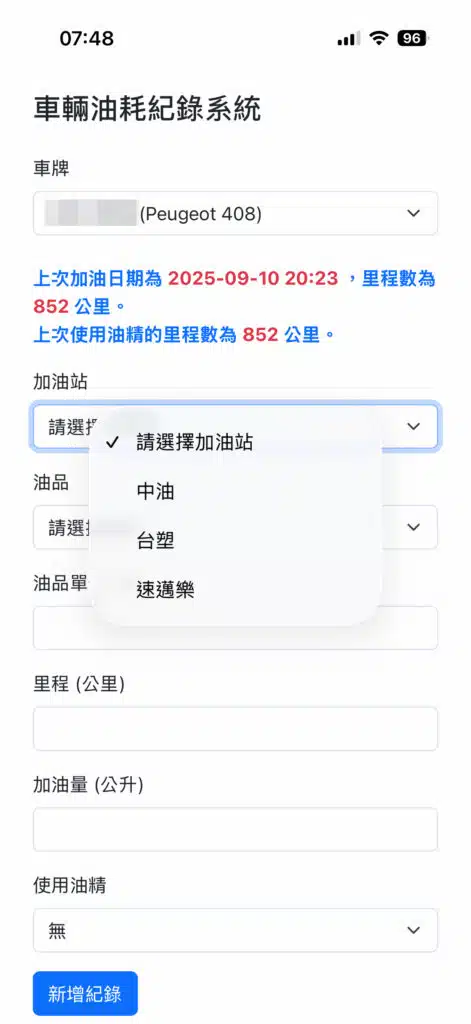
新增紀錄的話先選擇加油站
再選擇油品
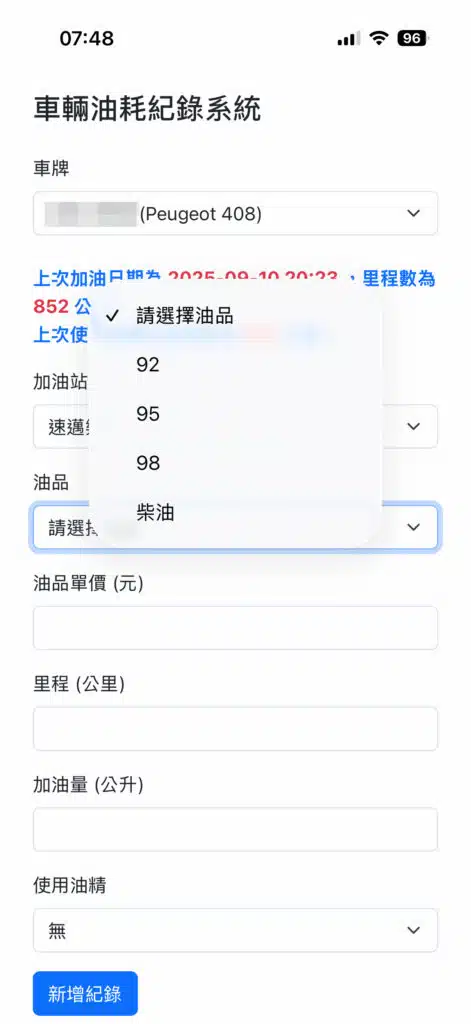
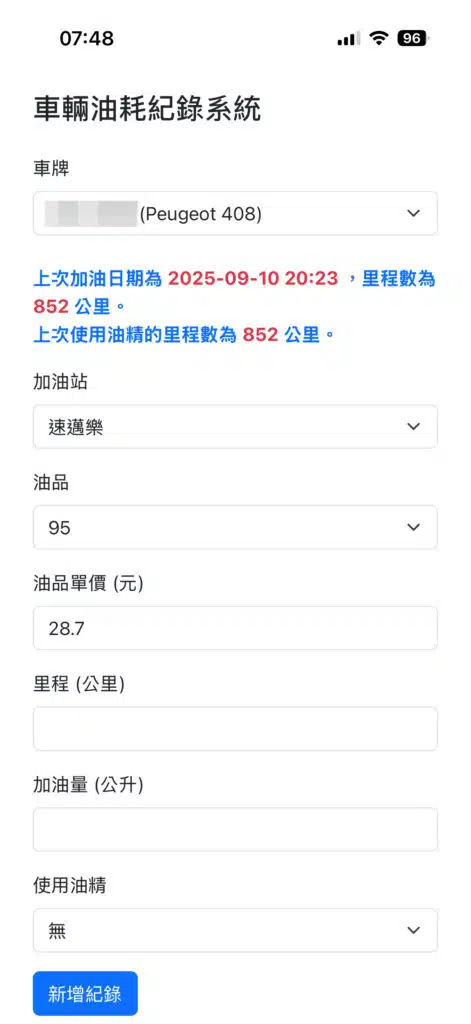
選完油品後會自動帶出當日的油價,不用自己填寫。
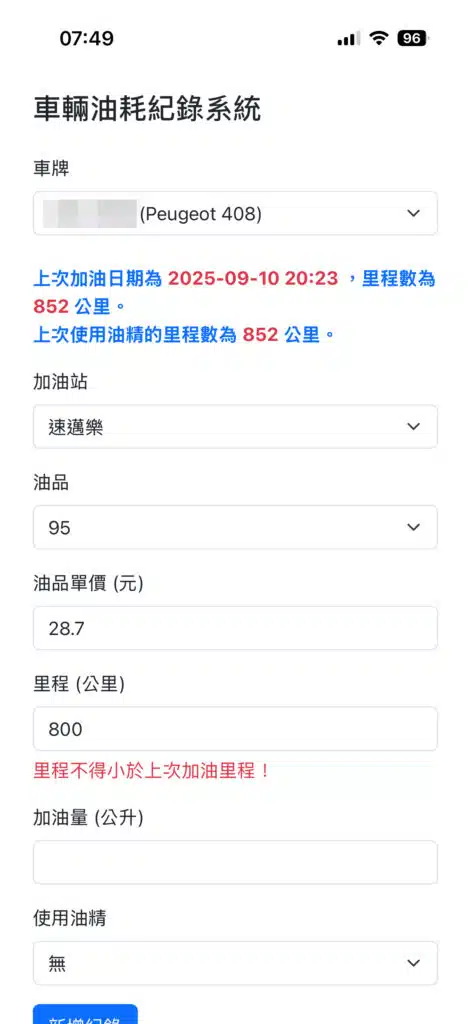
有里程數的檢查
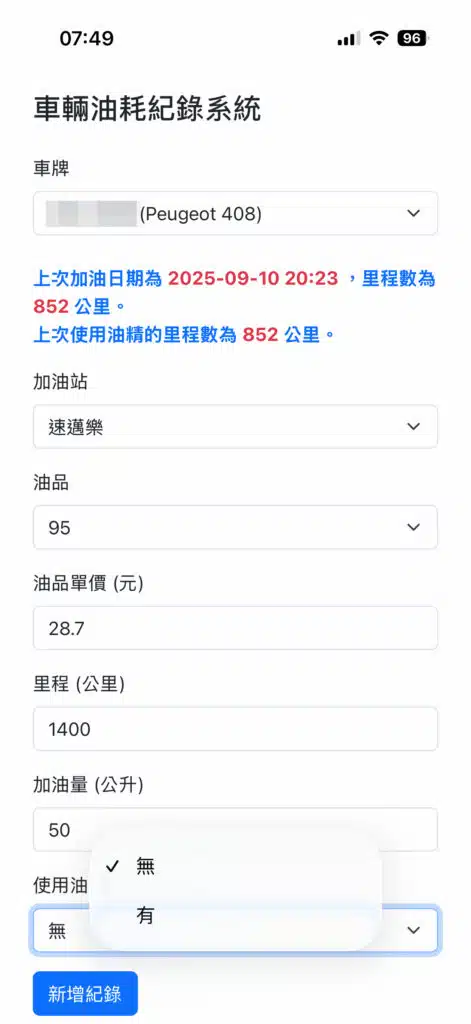
最後是有沒有使用汽油精的選項,填完後按新增紀錄即可。
程式碼的部分,用的是python flask的前後端網頁套件,資料庫用最簡單的sqlite3。
後端的部分
程式啟動時會檢查兩個資料表是否存在,若不存在則新增
- fuel_records 儲存加油日期、車牌、油品、單價、里程、加油量、成本與計算出的油耗效率。
- fuel_price 則儲存各加油站油品的最新油價。
首頁路由/會顯示指定車牌的所有加油紀錄,並提供表單新增新紀錄,程式會自動計算與上次里程的差距及每公升的油耗。
/last_record在前端選擇車牌後執行,提供JSON格式的最新紀錄、油耗走勢與最近一次使用添加劑的里程,回傳到前端做繪圖和其他提示。
/get_stations在選擇加油站時會讀取加油站列表跟當日各油品的單價、/get_records取得指定車牌的所有加油紀錄以及/insert_record負責新增紀錄。
from flask import Flask, render_template, request, redirect, url_for, jsonify, send_from_directory
import sqlite3
from datetime import datetime

app = Flask(__name__)

DB_FILE = "fuel_records.db"
CAR_PLATES = ["XXX-1234(Peugeot 408)", "YYY-1234(KIA SPORTAGE)"]

def init_db():
    with sqlite3.connect(DB_FILE) as conn:
        c = conn.cursor()
        # fuel_records table
        c.execute("""
            CREATE TABLE IF NOT EXISTS fuel_records (
                id INTEGER PRIMARY KEY AUTOINCREMENT,
                plate TEXT,
                record_date TEXT,
                station TEXT,
                fuel TEXT,
                price REAL,
                odo_reading REAL,
                volume REAL,
                distance REAL,
                cost REAL,
                fuel_efficiency REAL,
                fuel_additives TEXT
            )
        """)
        # fuel_price table
        c.execute("""
            CREATE TABLE IF NOT EXISTS fuel_price (
                id INTEGER PRIMARY KEY AUTOINCREMENT,
                company TEXT,
                oil_type TEXT,
                price REAL,
                price_date TEXT,
                UNIQUE(company, oil_type)
            )
        """)
        conn.commit()

init_db()

def get_stations():
    stations = {}
    with sqlite3.connect(DB_FILE) as conn:
        conn.row_factory = sqlite3.Row
        c = conn.cursor()
        c.execute("SELECT company, oil_type, price FROM fuel_price")
        rows = c.fetchall()
        for r in rows:
            company = r["company"]
            oil = r["oil_type"]
            price = r["price"]
            if company not in stations:
                stations[company] = {}
            stations[company][oil] = price
    return stations

def get_records(plate=None):
    with sqlite3.connect(DB_FILE) as conn:
        conn.row_factory = sqlite3.Row
        c = conn.cursor()
        if plate:
            c.execute("SELECT * FROM fuel_records WHERE plate=? ORDER BY record_date ASC", (plate,))
        else:
            c.execute("SELECT * FROM fuel_records ORDER BY record_date ASC")
        rows = c.fetchall()
        return [dict(r) for r in rows]

def insert_record(plate, record_date, station, fuel_type, price, odometer, liters, odo_diff, cost, fuel_eff, fuel_additives):
    with sqlite3.connect(DB_FILE) as conn:
        c = conn.cursor()
        c.execute("""
            INSERT INTO fuel_records
            (plate, record_date, station, fuel, price, odo_reading, volume, distance, cost, fuel_efficiency, fuel_additives)
            VALUES (?, ?, ?, ?, ?, ?, ?, ?, ?, ?, ?)
        """, (plate, record_date, station, fuel_type, price, odometer, liters, odo_diff, cost, fuel_eff, fuel_additives))
        conn.commit()

@app.route("/", methods=["GET", "POST"])
def index():
    stations = get_stations()
    if request.method == "POST":
        plate = request.form["plate"]
        record_date = datetime.now().strftime('%Y-%m-%d %H:%M')
        station = request.form["station"]
        fuel_type = request.form["fuel_type"]
        fuel_additives = request.form["fuel_additives"]
        price = float(request.form["price"])
        odometer = float(request.form["odometer"])
        liters = float(request.form["liters"])
        cost = liters * price

        records = get_records(plate)
        max_odo = max((float(r["odo_reading"]) for r in records), default=0.0)
        odo_diff = odometer - max_odo
        fuel_eff = round(odo_diff / liters, 2) if liters > 0 else 0.0

        insert_record(plate, record_date, station, fuel_type, price, odometer, liters, odo_diff, cost, fuel_eff, fuel_additives)

        return redirect(url_for("index", plate=plate))

    plate = request.args.get("plate")
    records = get_records(plate)

    return render_template("index.html",
                           plates=CAR_PLATES,
                           stations=stations,
                           records=records,
                           selected_plate=plate)

@app.route("/last_record/<path:plate>")
def last_record(plate):
    last_date = None
    last_odo = None
    last_add_odo = None
    dates = []
    effs = []
    ododiffs = []

    with sqlite3.connect(DB_FILE) as conn:
        conn.row_factory = sqlite3.Row
        c = conn.cursor()

        c.execute(
            "SELECT * FROM fuel_records WHERE plate=? ORDER BY record_date DESC LIMIT 1",
            (plate,)
        )
        latest = c.fetchone()
        if latest:
            last_date = latest["record_date"]
            last_odo = latest["odo_reading"]

        c.execute(
            "SELECT * FROM fuel_records WHERE plate=? AND fuel_additives='有' ORDER BY record_date DESC LIMIT 1",
            (plate,)
        )
        latest_add = c.fetchone()
        if latest_add:
            last_add_odo = latest_add["odo_reading"]
        else:
            last_add_odo = '0'

        c.execute(
            "SELECT record_date, fuel_efficiency, distance FROM fuel_records WHERE plate=? ORDER BY record_date ASC",
            (plate,)
        )
        rows = c.fetchall()
        for r in rows:
            dates.append(r["record_date"].split(" ")[0])
            effs.append(r["fuel_efficiency"])
            ododiffs.append(r["distance"])

    return jsonify({
        "date": last_date,
        "odometer": last_odo,
        "dates": dates,
        "effs": effs,
        "ododiffs": ododiffs,
        "last_add_odo": last_add_odo
    })

@app.route('/apple-touch-icon.png')
def apple_touch_icon():
    return send_from_directory('static', 'apple-touch-icon.png')

if __name__ == "__main__":
    app.run(host='0.0.0.0', port=xxxx)
前端的部分
前端使用Bootstrap 5排版並搭配Plotly.js繪圖。表單可選擇車牌、加油站、油品、輸入單價、里程、加油量與是否添加油精,並檢查里程不得小於上次紀錄及提醒超過 1000 公里未使用油精。下方表格動態顯示該車的加油歷史,圖表則同時呈現每次加油距離與油耗變化,方便使用者即時管理與分析油耗數據。
<!DOCTYPE html>
<html lang="zh-TW">
<head>
    <meta charset="UTF-8">
    <title>車輛油耗紀錄系統</title>
    <meta name="viewport" content="width=device-width, initial-scale=1">
    <link href="https://cdn.jsdelivr.net/npm/bootstrap@5.3.2/dist/css/bootstrap.min.css" rel="stylesheet">
    <style>
        table {
            font-size: 0.9rem;
        }
        @media (max-width: 768px) {
            table {
                font-size: 0.8rem;
            }
        }
    </style>
</head>
<body class="p-3">
<div class="container">
    <h2 class="mb-4">車輛油耗紀錄系統</h2>

    <form method="POST" class="mb-4 d-flex flex-column gap-3">
        <div>
            <label class="form-label">車牌</label>
            <select id="plate" name="plate" class="form-select" required>
                <option value="">請選擇車牌</option>
                {% for p in plates %}
                    <option value="{{ p }}" {% if p == selected_plate %}selected{% endif %}>{{ p }}</option>
                {% endfor %}
            </select>
        </div>

        <div id="last-info" class="mt-2" style="display:none;">
            <span class="fw-bold text-primary">上次加油日期為</span>
            <span id="last-date" class="fw-bold text-danger"></span>
            <span class="fw-bold text-primary">,里程數為</span>
            <span id="last-odo" class="fw-bold text-danger"></span>
            <span class="fw-bold text-primary">公里。</span>
            <br>
            <span class="fw-bold text-primary">上次使用油精的里程數為</span>
            <span id="last-add-odo" class="fw-bold text-danger"></span>
            <span class="fw-bold text-primary">公里。</span>
        </div>

        <div>
            <label class="form-label">加油站</label>
            <select id="station" name="station" class="form-select" required>
                <option value="">請選擇加油站</option>
                {% for s in stations.keys() %}
                    <option value="{{s}}">{{s}}</option>
                {% endfor %}
            </select>
        </div>

        <div>
            <label class="form-label">油品</label>
            <select id="fuel_type" name="fuel_type" class="form-select" required>
                <option value="">請選擇油品</option>
            </select>
        </div>

        <div>
            <label class="form-label">油品單價 (元)</label>
            <input type="number" step="0.1" name="price" id="price" class="form-control" required>
        </div>

        <div>
            <label class="form-label">里程 (公里)</label>
            <input type="number" step="0.1" name="odometer" id="odometer" class="form-control" required>
            <div id="odo-error" class="text-danger mt-1" style="display:none;">里程不得小於上次加油里程!</div>
            <div id="additive-warning" class="alert alert-warning mt-2 py-2 px-3" style="display:none;">
                ⚠ 建議使用油精,因為距離上次使用已超過 1000 公里!
            </div>
        </div>

        <div>
            <label class="form-label">加油量 (公升)</label>
            <input type="number" step="0.01" name="liters" class="form-control" required>
        </div>

        <div>
            <label class="form-label">使用油精</label>
            <select id="fuel_additives" name="fuel_additives" class="form-select" required>
                <option value="無">無</option>
                <option value="有">有</option>
            </select>
        </div>

        <div>
            <button type="submit" class="btn btn-primary">新增紀錄</button>
        </div>
    </form>

    <div id="chart-container" class="mb-3"></div>

    <div id="table-container">
        <table class="table table-bordered table-striped">
            <thead>
                <tr>
                    <th>日期</th>
                    <th>油品</th>
                    <th>里程</th>
                    <th>距離</th>
                    <th>油量</th>
                    <th>油耗</th>
                    <th>油精</th>
                </tr>
            </thead>
            <tbody id="table-body">
            </tbody>
        </table>
    </div>
</div>

<script src="https://cdn.plot.ly/plotly-2.29.1.min.js"></script>
<script>
    const stationsData = {{ stations | tojson }};
    const stationSelect = document.getElementById("station");
    const fuelSelect = document.getElementById("fuel_type");
    const priceInput = document.getElementById("price");
    const plateSelect = document.getElementById("plate");
    const tableBody = document.getElementById("table-body");
    const allRecords = {{ records | tojson }};

    const odometerInput = document.getElementById("odometer");
    const odoErrorDiv = document.getElementById("odo-error");
    const additiveWarning = document.getElementById("additive-warning");
    const lastOdoSpan = document.getElementById("last-odo");
    const lastAddOdoSpan = document.getElementById("last-add-odo");

    stationSelect.addEventListener("change", function() {
        const fuels = stationsData[this.value] || {};
        fuelSelect.innerHTML = "<option value=''>請選擇油品</option>";
        for (const f in fuels) {
            const opt = document.createElement("option");
            opt.value = f;
            opt.textContent = f;
            fuelSelect.appendChild(opt);
        }
        priceInput.value = "";
    });

    fuelSelect.addEventListener("change", function() {
        const station = stationSelect.value;
        const fuel = this.value;
        if (station && fuel && stationsData[station][fuel] !== undefined) {
            priceInput.value = stationsData[station][fuel];
        } else {
            priceInput.value = "";
        }
    });

    function renderTable(records) {
        console.log(records)
        tableBody.innerHTML = "";
        if (records.length > 0) {
            records.forEach(r => {
                const d = new Date(r["record_date"]);
                const dateStr = `${String(d.getMonth() + 1).padStart(2, "0")}-${String(d.getDate()).padStart(2, "0")}`;
                const odo = Math.round(r["odo_reading"]);
                const ododiff = Math.round(r["distance"]);
                const fuel = parseFloat(r["volume"]).toFixed(1);
                const eff = parseFloat(r["fuel_efficiency"]).toFixed(1);
                const stationFuel = (r["station"] ? r["station"].charAt(0) : "") + (r["fuel"] || "");
                const add = r["fuel_additives"];
                const tr = document.createElement("tr");
                tr.innerHTML = `
                    <td>${dateStr}</td>
                    <td>${stationFuel}</td>
                    <td>${odo}</td>
                    <td>${ododiff}</td>
                    <td>${fuel}</td>
                    <td>${eff}</td>
                    <td>${add}</td>
                `;
                tableBody.appendChild(tr);
            });
        }
    }

    function getLastOdoValue() {
        const val = lastOdoSpan.textContent;
        return val ? parseFloat(val) : 0;
    }

    function getLastAddOdoValue() {
        const val = lastAddOdoSpan.textContent;
        return val ? parseFloat(val) : null;
    }

    odometerInput.addEventListener("input", function() {
        const lastOdo = getLastOdoValue();
        const lastAddOdo = getLastAddOdoValue();
        const current = parseFloat(this.value);

        if (!isNaN(current) && current <= lastOdo) {
            odoErrorDiv.style.display = "block";
            this.setCustomValidity("里程不得小於上次加油里程!");
        } else {
            odoErrorDiv.style.display = "none";
            this.setCustomValidity("");
        }

        if (!isNaN(current) && lastAddOdo !== null && (current - lastAddOdo >= 1000)) {
            additiveWarning.style.display = "block";
        } else {
            additiveWarning.style.display = "none";
        }
    });

    document.querySelector("form").addEventListener("submit", function(e) {
        const lastOdo = getLastOdoValue();
        const current = parseFloat(odometerInput.value);
        if (!isNaN(current) && current <= lastOdo) {
            alert("里程不得小於上次加油里程!");
            e.preventDefault();
        }
    });

    function renderChart(selectedPlate) {
        const chartContainer = document.getElementById("chart-container");
        chartContainer.innerHTML = "";
        if (!selectedPlate) return;

        fetch(`/last_record/${encodeURIComponent(selectedPlate)}`)
            .then(res => res.json())
            .then(data => {
                const lastInfoDiv = document.getElementById("last-info");
                const lastDateSpan = document.getElementById("last-date");

                if (data.date && data.odometer) {
                    lastDateSpan.textContent = data.date;
                    lastOdoSpan.textContent = data.odometer;
                    lastInfoDiv.style.display = "block";
                } else {
                    lastInfoDiv.style.display = "none";
                }

                if (data.last_add_odo) {
                    lastAddOdoSpan.textContent = data.last_add_odo;
                } else {
                    lastAddOdoSpan.textContent = "";
                }

                if (!data.dates || data.dates.length === 0) return;

                const dates = data.dates;
                const effs = data.effs;
                const ododiffs = data.ododiffs;
                const barCount = dates.length;
                const bargap = Math.min(1, Math.max(0.05, 1 - (barCount * 0.04)));

                Plotly.newPlot(chartContainer, [
                    {
                        x: dates,
                        y: ododiffs,
                        name: "距離(km)",
                        type: "bar",
                        yaxis: "y2",
                        marker: { color: 'rgba(135,206,250,0.5)' }
                    },
                    {
                        x: dates,
                        y: effs,
                        name: "油耗(km/L)",
                        type: "scatter",
                        mode: "lines+markers",
                        yaxis: "y1",
                        marker: { color: 'rgba(205,92,92,1)', size: 12 },
                        line: { color: 'rgba(205,92,92,1)', width: 2 }
                    }
                ], {
                    yaxis: { title: "油耗(km/L)" },
                    yaxis2: { title: "距離(km)", overlaying: "y", side: "right" },
                    xaxis: { title: "日期", tickformat: "%m-%d" },
                    height: 400,
                    margin: { l:50, r:50, t:70, b:50 },
                    legend: { x:0, y:1.1, orientation:"h" },
                    bargap: bargap
                });
            });
    }

    const initialPlate = "{{ selected_plate }}";
    if (initialPlate) {
        const filtered = allRecords.filter(r => r["plate"] === initialPlate);
        renderTable(filtered);
        renderChart(initialPlate);
    } else {
        renderTable([]);
    }

    plateSelect.addEventListener("change", function() {
        const selectedPlate = this.value;
        const filtered = allRecords.filter(r => r["plate"] === selectedPlate);
        renderTable(filtered);
        renderChart(selectedPlate);
    });
</script>

</body>
</html>

